
This article outlines how to use and interpret the alarms page and its list of your recent alarms.
How can it help you?
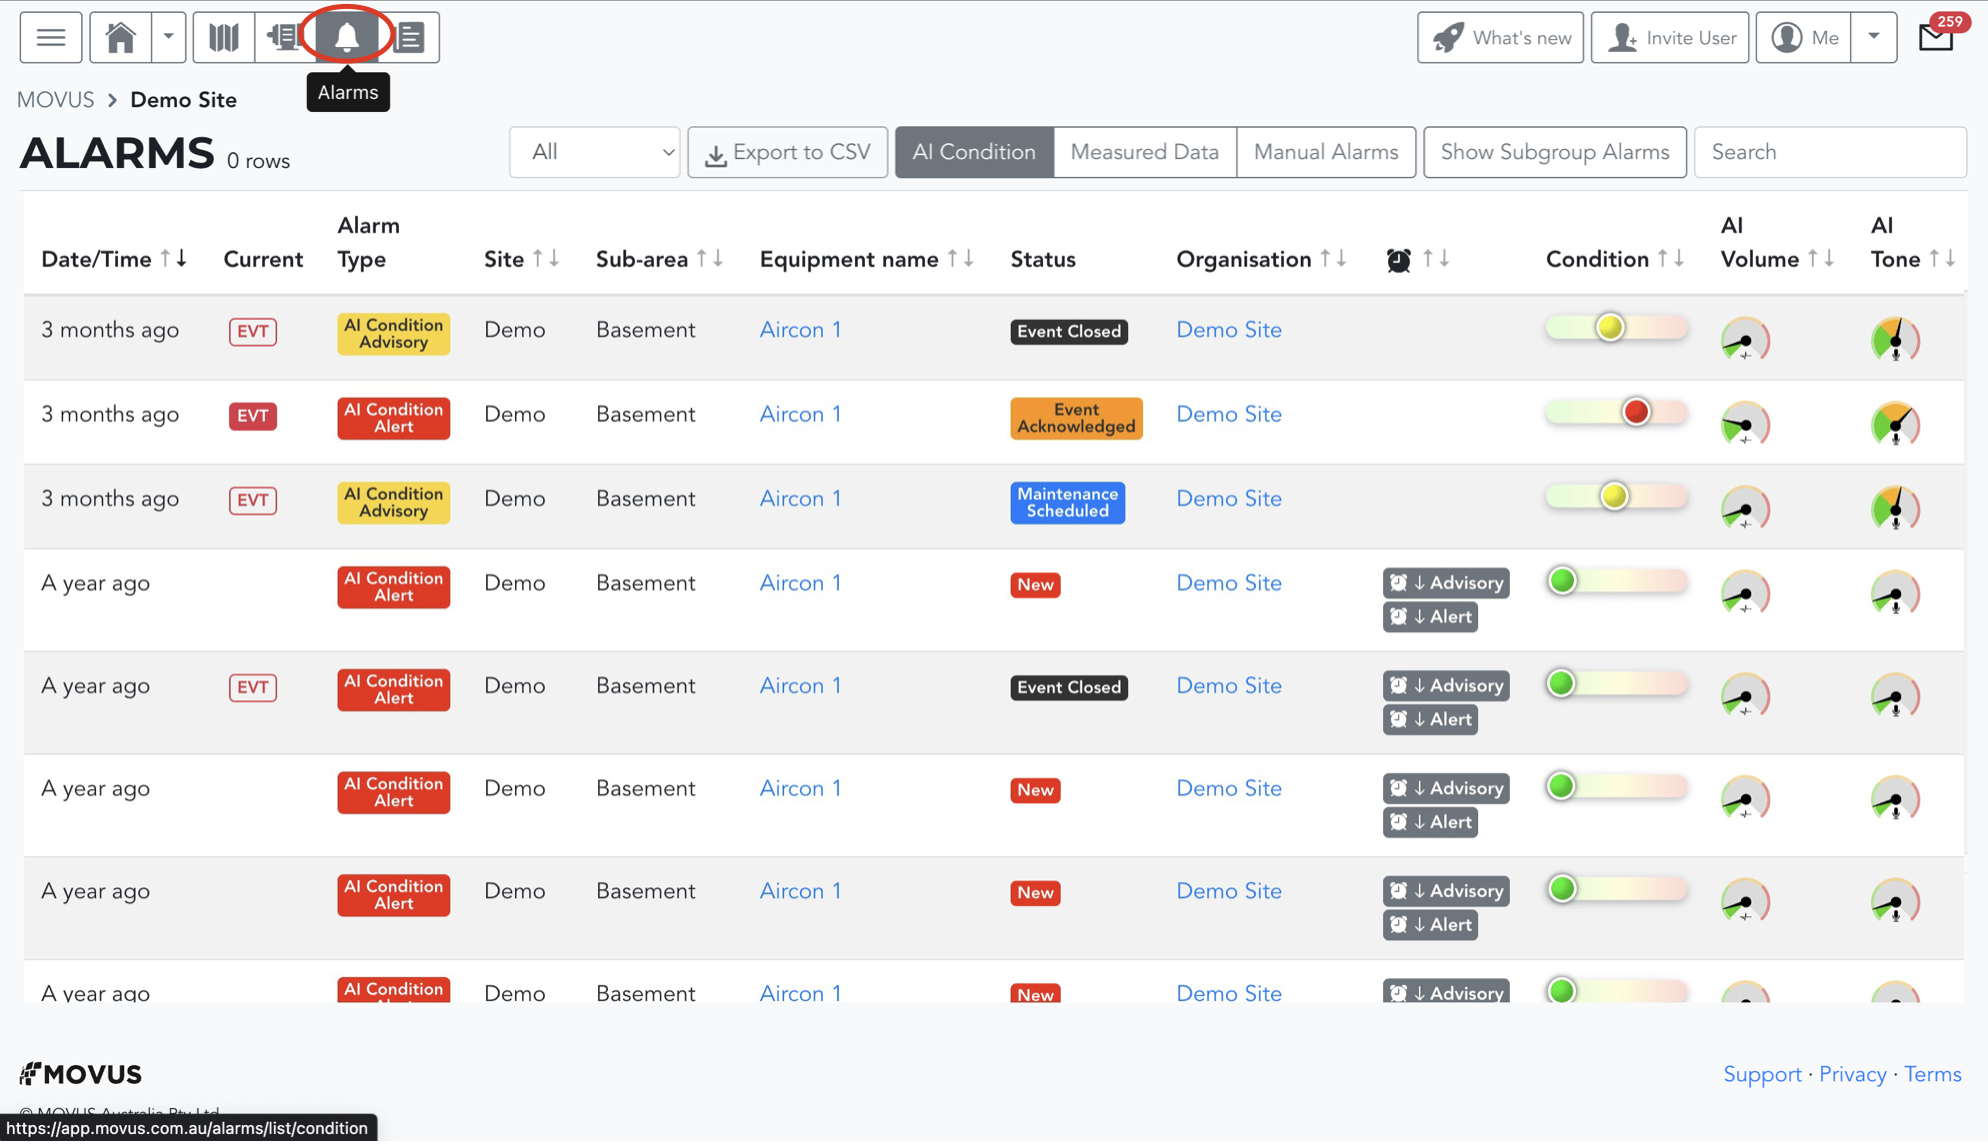
The alarms page lists the alarms that have occurred from your system. Here you can find information about your equipment at the time of each alarm.
You can use the alarms page to review previous alarms on your equipment, what may have triggered each, how your team resolved them and more. Thus, this page can help you gather learnings from previous actions taken on your equipment.
You can open the Equipment Name link to take a closer look at the data coming from the FitMachine sensor on the Equipment Detail Page. You can also click anywhere along the row to open up the Alarm Detail Page for that particular alarm.
How does it work?
How do I access it?
The alarms page is available to all users and can be accessed by clicking the alarm bell in the top left-hand corner of your dashboard.
This page will show the most recent alarm at the top of the list.
Key Features
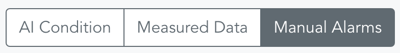
The page is divided into AI Condition Alarms (Red Alerts and Yellow Advisories), Measured Data Alarms and Manual Alarms. You can toggle which kind of alarms you are looking at in the top right, shown here:
Using the dropdown menu to the left of these buttons, you can filter through alarms to only view those from the last week, month, or year instead of all alarms. If you want to find out how many times a particular piece of equipment has sent an alarm, you can search for the equipment name in the search bar. You can also select the "Show Subgroup Alarms" button next to the search bar to include the alarms from the equipment in the subgroups of your selected Device Group in your view. This is explained in our article Understanding Device Groups. The information displayed in this list can be saved by clicking the "Export to CSV" button.
AI Condition Alarms
The following information can be found for each alarm:
- Date/Time: When the alarm occurred
-
Current: Whether this alarm is part of a current (
 ) or previous (
  ) event. Previous events have been closed. This is explained in more detail in our article What are Events?
 - Alarm Type: Yellow Advisory or Red Alert
-
Site Name: The location of the plant
-
Sub-Area Name: The area within the plant where the equipment is located
-
Equipment Name: What you call the piece of equipment
- Status: This shows you where the alarm progression is at (new, acknowledged, valid, invalid), and thus whether or not you need to take action
- Organisation: Your organisation's name
- Custom Alarm Thresholds (alarm clock): This column will appear if any thresholds have been customised on your equipment. The column will show which equipment has alarm thresholds other than the default.
- Condition: This slider indicates the health of your asset at the time of the alarm. The further away from the green the slider is, the further the asset's condition deviated from its learned baseline. This slider is the primary source used to trigger alarms.
- Three Dials (AI Volume, Tone & Temperature): The dials show you which factors are affecting the Overall AI condition. Use them to understand what was happening with your equipment when the alarm occurred.
- Vibration: Shows you the RMS measurement at the time of the alarm
- Temperature: Shows you the temperature measurement at the time of the alarm
Measured Data Alarms
The following information can be found for each alarm:
- Date/Time: When the alarm occurred
- Current: Whether this alarm is part of a current (solid red) or previous (transparent) event. Previous events have been closed. This is explained in more detail in our article What are Events?
- Transitioned to: Tells you how the state changed (either into an alarm or back to normal)
- Alarm Name: The type of measured data threshold that was exceeded
-
Site Name: The location of the plant
-
Sub-Area Name: The area within the plant where the equipment is located
-
Equipment Name: What you call the piece of equipment
- Status: This shows you where the alarm progression is at (new, acknowledged, valid, invalid), and thus whether or not you need to take action
- Organisation: Your organisation name
- Threshold: This column state the measured data reading compared to the threshold. You can use this to understand how much the asset's condition deviated from its normal state.
Manual Alarms
The following information can be found for each alarm:
- Date/Time: When the alarm occurred
-
Current: Whether this alarm is part of a current (solid red) or previous (transparent) event. Previous events have been closed. This is explained in more detail in our article What are Events?
- Summary: An overview of what happened, as entered by the individual who reported the alarm.
-
Site Name: The location of the plant
-
Sub-Area Name: The area within the plant where the equipment is located
-
Equipment Name: What you call the piece of equipment
- Status: This shows you where the alarm's/event's progression is at (e.g. new, acknowledged, valid, invalid), and thus whether or not you need to take action
- Organisation: Your organisation name
- Description: The detailed description happened, as entered by the individual who reported the alarm
- Reported By: Who submitted the alarm via its Equipment Detail Page.
What else should I look at?
These are some of our related articles:
- The Equipment List Page
- The Equipment Detail Page
- The Home Page
- The What's New Page
- Understanding Event Feedback
- How to Respond to MOVUS Alarms
---
Thanks for reading. If you have any questions or concerns, please reach out to MOVUS Support here.