
The Standard Dashboard is the default Home Page that summarises your FitMachine system to help you decide if action is required on any asset or FitMachine.
How can it help you?
The Standard Home Page provides an overview of your FitMachine system, such as the state of your equipment and your FitMachines.
This page is designed to make it easier to see the big picture and understand the overall performance and condition of your system. By having an overview of everything in one place, you can quickly access and analyze all your data and thus efficiently target the areas that need work, instead of searching through different pages to find the information you need.
How does it work?
How do I access it?
The Home Page icon in the top left-hand corner of your dashboard now includes a drop-down box to allow you to select the Management Dashboard, Plant Room Dashboard or Standard (Default) Home Dashboard. Selecting the Standard Dashboard will bring you to this page.
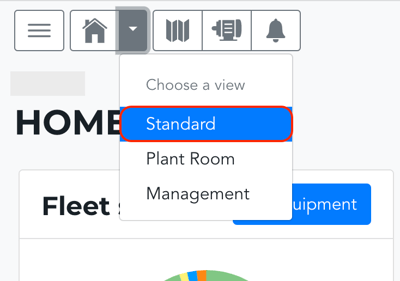
Your home page will automatically open on the last dashboard selected.
Key Features
The Standard Dashboard includes 6 key tiles. These are the:
- Fleet Status Tile
- Hours and Equipment Monitored Tile
- FitMachine Status Tile
- Most Recent Events Tile
- Highest Vibrating Equipment Tile
- Highest Temperature Equipment Tile, and the
- Non-Reporting FitMachines Tile.
Fleet Status
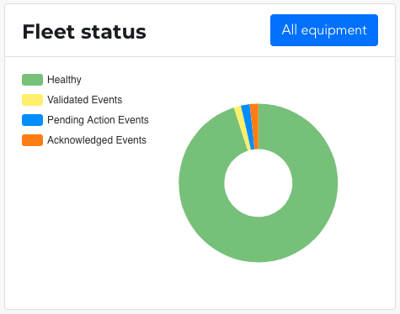
The Fleet Status tile is a donut chart showing the event status of your equipment. There are four different statuses your equipment can be in:
-
Healthy: Equipment that is not alarming / in an event state
- Validated Events: Equipment with an event that has been marked as 'valid'
- Pending Action Events: Equipment with an event that is pending maintenance action. That is, the event is valid and requires maintenance activity to be scheduled, or the equipment has been scheduled for maintenance and has a date on which this will occur.
- Acknowledged Events: Equipment with an event in an 'acknowledged' status that requires investigation by your team.
Mousing over the chart shows a description of the quantity of equipment in that category.
The 'All Equipment' button links to the Equipment List page.
Hours and Equipment Monitored
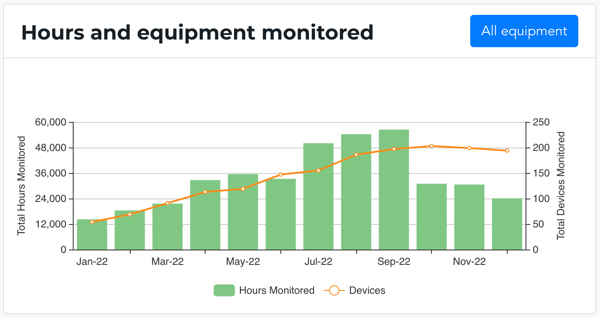
This bar chart highlights, for the past 12 months, the quantity of equipment monitored and the total hours they have been monitored for.
The quantity of devices is presented as an orange line chart, and the total hours monitored is presented as a green bar chart.
The 'All Equipment' button links to the Equipment List page.
FitMachine Status
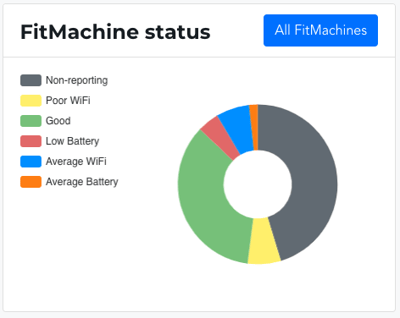
The FitMachine Status tile is a donut chart showing the reporting, battery and WiFi status of your FitMachines. This ignores the health status of your equipment (e.g. alarms and event states). There are six different statuses your FitMachines can be in:
- Non-Reporting
- Poor WiFi
- Good
- Low Battery
- Average WiFi
- Average Battery
Understanding, and responding to, the state of your FitMachines is important to ensure your sensors are functioning properly and providing accurate data. If your sensors are not functioning properly, it can lead to inaccurate or incomplete data, making it difficult to effectively and accurately monitor the condition of your machines.
These statuses and how to respond to them are explained in our article What is the FitMachine Status Column telling me to do?
The 'All FitMachines' button links to the FitMachine Admin page.
Most Recent Events
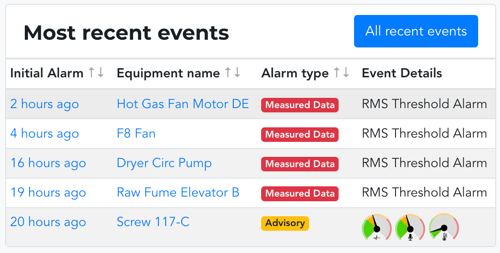
This lists up to five pieces of equipment that are currently in an event state. and their events have not yet been resolved or closed. There are four columns on this tile. They include:
- Initial Alarm: This shows the date of the first alarm for that event. Clicking on the timeframe will take you to the Alarm Detail Page.
- Equipment Name: Links to the equipment's Detail Page.
- Alarm Type: Highlights whether the initial alarm was a Measured Data Alarm, Red Alert, or Yellow Advisory. The colour depicts the urgency of the event.
- Event Details: Shows the reason the event was triggered.
The 'All Recent Events' button links to the Events List Page.
Highest Vibrating Equipment
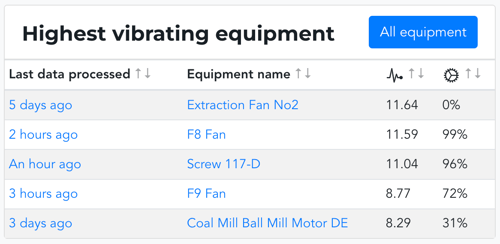
This lists up to five pieces of equipment with the current highest recorded vibration levels. The list is ordered by equipment with the largest value mm/s in descending order. There are four columns on this tile. They include:
- Last Data Processed: This column displays the time the sample was received from that FitMachine. The text links to the equipment's detail page.
- Equipment Name: Links to the equipment's detail page.
- Vibration: Shows the vibration measurement. The unit of measure shown is based on your selected units of measure preferences.
- Utilisation: Show the utilisation percentage for that equipment.
This
The 'All Equipment' button links to the Equipment List page.
Highest Temperature Equipment
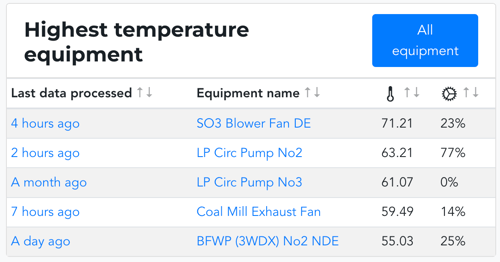
This lists up to five pieces of equipment with the current highest recorded temperatures. The list is ordered by equipment with the highest temperature in descending order. There are four columns on this tile. They include:
- Last Data Processed: This column displays the time the sample was received from that FitMachine. The text links to the equipment's detail page.
- Equipment Name: Links to the equipment's detail page.
- Temperature: Shows the temperature data. The unit of measure shown is based on your selected units of measure preferences.
- Utilisation: Show the utilisation percentage for that equipment.
Non-Reporting FitMachines
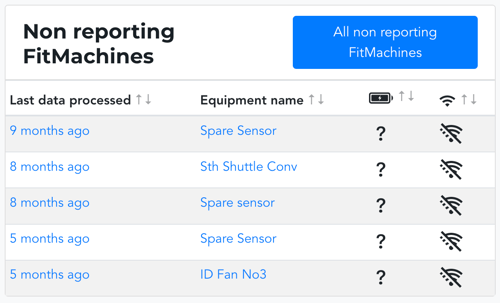
This lists up to five pieces of equipment with non-reporting FitMachines. The list is ordered by equipment with the oldest Last Data Processed time period in descending order. There are four columns on this tile. They include:
- Last Data Processed: Displays the time the last samples were received from that FitMachine. The text links to the equipment's detail page.
- Equipment Name: Links to the equipment's detail page.
- Battery Health: This shows the condition of the battery from the last sample. Mousing over the icon brings up the battery voltage, if available.
- Network Health: This shows the condition of the WiFi from the last sample. Mousing over the icon brings up the WiFi strength, if available.
What else should I look at?
These are some of our related articles:
---
Thanks for reading. As always, if you have any questions or concerns please reach out to MOVUS Support here.