
The Plant Room Dashboard is a new Home Page view that summarises the current progress of alarms and events.
How can it help you?
The Plant Room Dashboard is an alternative home page that has been designed to give a snapshot to maintenance teams of the current progress of alarms and events detected by FitMachine. Designed with toolbox meetings in mind, it provides an easy way of seeing what's happening with a site or subarea's equipment at any point in time.
Effective use of this dashboard can provide you with a quick and easy way to identify and address problems as quickly as possible, reducing downtime and ensuring your machines are running at their peak performance. What's more, it can help your teams to plan and schedule maintenance and repair activities more effectively, improving the overall efficiency and productivity of your maintenance process.
How does it work?
How do I access it?
The Home Page icon in the top left-hand corner of your dashboard now includes a drop-down box to allow you to select the Management Dashboard, Plant Room Dashboard or Standard (Default) Home Dashboard. Selecting Plant Room Dashboard will bring you to this page.
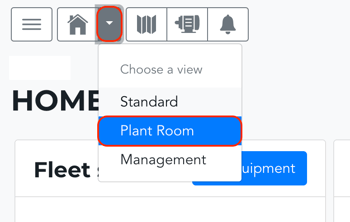
Your home page will automatically open on the last dashboard selected.
Key Features
The Plant Room Dashboard includes 7 key tiles. These are the:
- Fleet Status Tile
- Equipment Condition Trend Tile
- FitMachine Status Tile
- Most Recent Events Tile
- Acknowledged Events Tile
- Validated Events Tile
- Pending Action Events Tile
Fleet Status
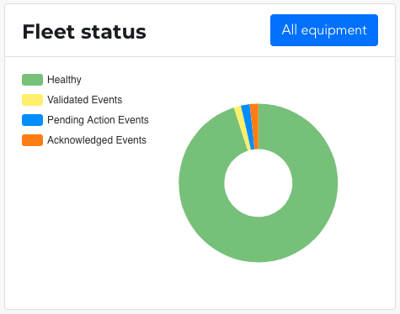
The Fleet Status tile is a donut chart showing the event status of your equipment. There are four different statuses your equipment can be in:
-
Healthy: Equipment that is not alarming / in an event state
- Validated Events: Equipment with an event that has been marked as 'valid'
- Pending Action Events: Equipment with an event that is pending maintenance action. That is, the event is valid and requires maintenance activity to be scheduled, or the equipment has been scheduled for maintenance and has a date on which this will occur.
- Acknowledged Events: Equipment with an event in an 'acknowledged' status that requires investigation by your team.
Mousing over the chart shows a description of the quantity of equipment in that category.
The 'All Equipment' button links to the Equipment List page.
Equipment Condition Trend
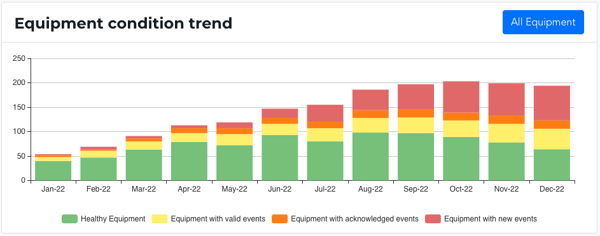
This bar chart provides a snapshot of your equipment's status for a given day at the end of 23:59 UTC (the consolidation of some equipment groups may result in equipment in multiple time zones).
Similar to the Fleet Status tile, it displays the quantity of equipment in a healthy state, equipment with valid events and equipment with acknowledged events. However, here it also includes equipment with new events on which no action has been taken.
The 'All Equipment' button links to the Equipment List page.
FitMachine Status
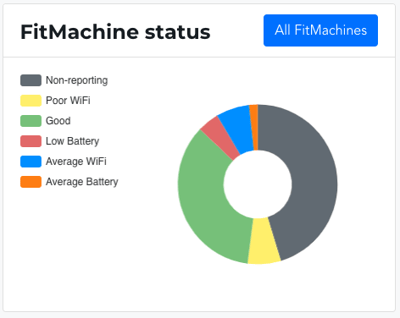
The FitMachine Status tile is a donut chart showing the reporting, battery and WiFi status of your FitMachines. This ignores the health status of your equipment (e.g. alarms and event states). There are six different statuses your FitMachines can be in:
- Non-Reporting
- Poor WiFi
- Good
- Low Battery
- Average WiFi
- Average Battery
Understanding, and responding to, the state of your FitMachines is important to ensure your sensors are functioning properly and providing accurate data. If your sensors are not functioning properly, it can lead to inaccurate or incomplete data, making it difficult to effectively and accurately monitor the condition of your machines.
These statuses and how to respond to them are explained in our article What is the FitMachine Status Column telling me to do?
The 'All FitMachines' button links to the FitMachine Admin page.
Most Recent Events
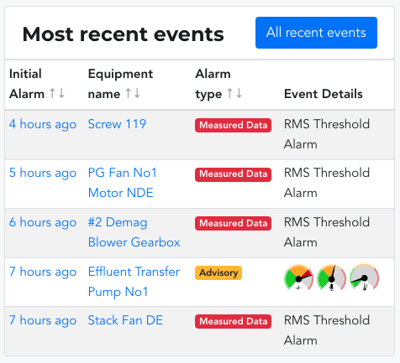
This lists up to five pieces of equipment that are currently in an event state. and their events have not yet been resolved or closed. There are four columns on this tile. They include:
- Initial Alarm: This shows the date of the first alarm for that event. Clicking on the timeframe will take you to the Alarm Detail Page.
- Equipment Name: Links to the equipment's Detail Page.
- Alarm Type: Highlights whether the initial alarm was a Measured Data Alarm, Red Alert, or Yellow Advisory. The colour depicts the urgency of the event.
- Event Details: Shows the reason the event was triggered.
The 'All Recent Events' button links to the Events List Page.
Acknowledged Events
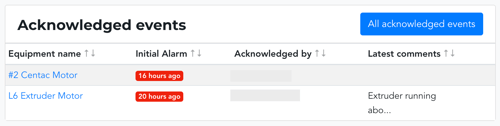
This lists the equipment with events in an acknowledged alarm state (ie. they have not been investigated for validity, and no action has been taken). There are four columns on this tile. They include:
- Equipment Name: Links to the equipment's detail page
- Initial Alarm: This shows the date of the first alarm since the last closed event. Where an asset has not previously alarmed, it will show the duration of the first alarm.
- Acknowledged By: Displays the user that acknowledged the event
- Latest Comments: Displays the latest comment associated with the event.
The 'All Acknowledged Events' button links to the Events List Page, filtered to only show acknowledged events.
Validated Events
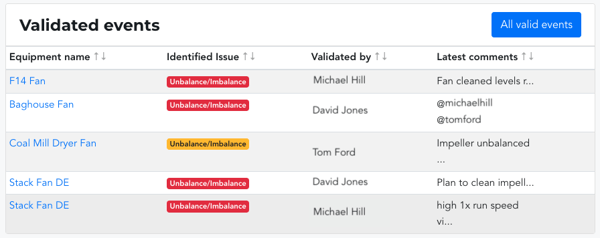
This shows the equipment currently with a valid alarm status. This means the alarm has been acknowledged as valid, and your team found something wrong. There are four columns on this tile. They include:
- Equipment Name: Links to the equipment's detail page
- Identified Issue: This displays what category of issue was identified in the event (ie. was it an equipment failure or imbalance?).
- Validated By: Displays the user that validated the event
- Latest Comments: Displays the latest comment associated with the event.
The 'All Valid Events' button links to the Events List page, filtered to only show events marked as valid.
Pending Action Events
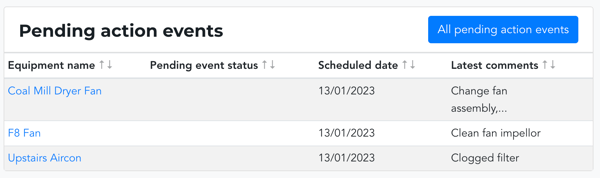
This tile list equipment in a pending action state. That is, the event has been marked as valid, and the equipment has been scheduled for maintenance (has a scheduled date on which this will occur).
There are four columns on this tile. They include:- Equipment Name: Links to the equipment's detail page
- Pending Event Status: This shows the current status.
- Scheduled Date: The date an action is currently scheduled for.
- Latest Comments: Displays the latest comment associated with the event.
The 'All Pending Action Events' button goes to the Event List with a filter of open pending action events.
What else should I look at?
- About the Home Page
- About Alarm Statuses
- Understanding Event Impact
- Understanding Event Feedback
- Understanding the Management Dashboard
---
Thanks for reading. As always, if you have any questions, please contact our MOVUS Support Team here.