
This article outlines how to use and interpret the Events page.
How does it help you?
The Event List Page provides an overview of the events that have occurred within your system. Events, as explained in our article What are Events, group alarms and comments related to the same issue together to create manageable activities.
With a snapshot of relevant information on events and their status, this page provides an effective summary and quick overview of your equipment's history and the outcomes of each event.
How does it work?
The Event List Page lists all of the equipment which have experienced an event since the installation of your sensors. For each piece of equipment, it provides a summary of its five most recent events (where applicable).
Remember that you will only see the related events for the Device Group you have selected in the Groups sidebar! If you wish to include the equipment in the subgroups of your selected Device Group, click the "Show Subgroup Events" button next to the search bar.
The page is ordered to have your equipment listed in reverse chronological order. As such, the equipment with the most recent events will be at the top of the page. If you prefer otherwise, you can click the arrows next to each heading to reorder the events. For example, resorting by status.
You can also use the search bar to find a specific piece of equipment by typing either its name or MAC address.
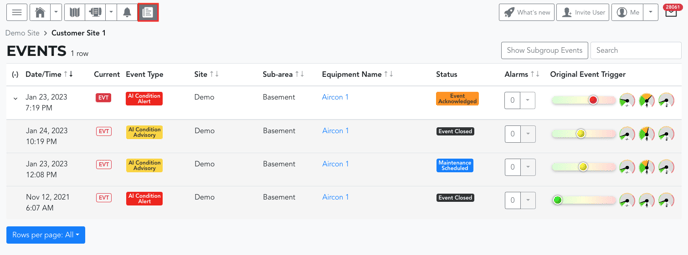 By default, you will only see details of the most recent Event for each piece of equipment. For each Event, you will see:
- Date/Time: The date and time of the Event's initiating alarm.
- Current: Whether the Event is a current (
 ) or previous (
  ) Event. Previous Events have a 'closed' status. This is explained in more detail in our article What are Events?
 - Event Type: Which type of alarm was initially triggered, including AI Condition (Red) Alerts, AI Condition (Yellow) Advisories, RMS Threshold Alarms, and Temperature Threshold Alarms.
- Site: The location of the plant.
- Sub-Area: The location within the plant where the equipment is.
- Equipment Name: What you call the piece of equipment. This links to the equipment's Detail Page.
- Status: The status of the event. To learn more please read our article About Alarm and Event Statuses.
- Alarms: The number of alarms grouped as part of that Event. This includes the initial alarm that created the Event (ie., a minimum of 1). You can click the arrow next to the alarm number to open a flyout menu. This menu will list the Date/Time, Status and Trigger for each alarm included in that Event.
- Original Event Trigger: Details of the condition change/s that triggered the first alarm/Event.
Clicking anywhere along each row will take you to the Event Detail Page of the selected Event.
Where applicable, you will also see an arrow next to the Event's Date/Time. By clicking the arrow, this will expand its event history and display the event details for the four other most recent events on that equipment.
What else should I look at?
---
Thanks for reading. If you have any questions or concerns, please reach out to MOVUS Support here.