
This article explains the eight features you'll find on the Waveform Diagnostic page and how to use them.
How can it help you?
The time waveform feature is essential for understanding how your equipment's vibration changes. This feature has also been called FitScope.
Most monitoring techniques don't provide data every 15 minutes, so this feature gives you insights into how your equipment changes its behaviour daily. It is configured to update every 24 hours on a rolling basis for each FitMachine.
With it, you can see and hear changes in the vibration of the equipment, which can help you to identify operational changes and equipment faults and optimise your production. In particular, this feature helps identify transient issues that may be missed or are challenging to capture.
How does it work?
The Waveform feature contains several different visualisation tools. As a whole, it includes eight key elements. These are the:
- Playback specifics
- Time waveform plot and audio recreation playback
- Spectrogram
- Control panel
- Live FFT visualiser
- Options panel
- Data, and
- The activity table.
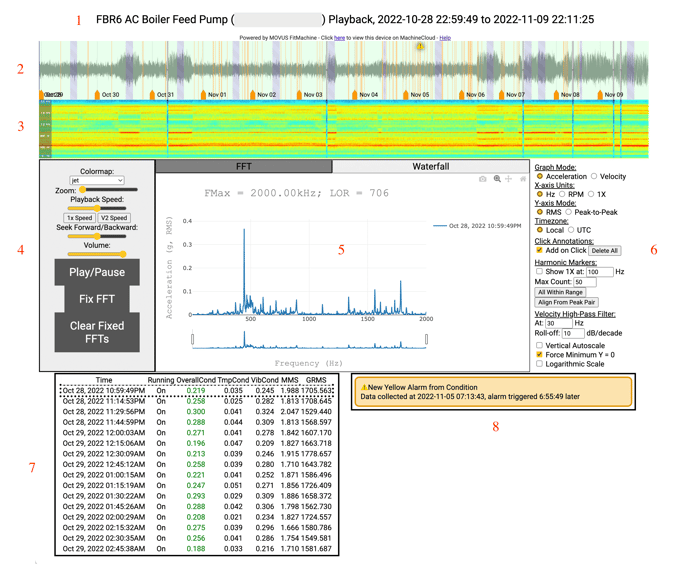
1. Playback Specifics
The playback specifics are the text you'll find across the top of the page. This provides the equipment name, the FitMachine MAC address, and the date range that you can view.
Usually, you will be able to view and listen to the output of this machine for the previous three days. However, we can produce longer-duration waveforms (up to 1 month) on request.
2. Time Waveform Plot and Audio Recreation Playback
The time waveform displays a vibration wave that can help you understand how much the equipment is vibrating. Here you can visually see changes in the collected vibration over time and listen to the sound collected from your machine.
Clicking the Play/Pause button in the control panel will cause a line to track across the waveform and play a reproduction of the sound across the provided time period. You can also zoom in using the control panel and click along the time waveform to listen to what the machine sounded like at a particular time.
Moving your cursor along the plot shows the location of the current audio playback and live FFT.
The article Understanding the Time Waveform Plot outlines what the plot is, how to interpret it, and how it helps you in greater detail.
3. Spectrogram
A spectrogram is an excellent tool for reviewing changes in the vibration spectrum of your equipment.
A spectrogram accompanies each set of time series data to visually demonstrate changes in frequency profile over time. It's similar to a top-down view of a waterfall plot, where each vertical line is one of the FFTs we've collected. So the x-axis is time, and the y-axis is frequency, with peaks in an FFT represented by a brighter colour on the spectrogram.
Notably, as you mouse over the spectrogram using your cursor, a line will appear on the FFT that highlights the frequency you are viewing.
The article What is a Spectrogram? outlines in greater depth what it is, how to interpret it, and how it helps you.
4. Control Panel
- Colourmap: This allows you to change the colour mapping of the spectrogram. A series of colour schemes are available, which show the contrast between high- and low-amplitude signals in different colours. This feature is discussed in more detail here.
- Zoom: You can scroll the slider to analyse a portion of a spectrum and adjust the timeframe you are viewing. This adjusts both the time waveform and the spectrogram.
- Playback Speed: Adjusting the playback speed lets you skim through the data faster or slower. This allows you to slow down and hear something of interest (returning to normal speed afterwards) or potentially speed past uninteresting sections. For real-time audio playback on V3s, choose the default 1x speed. For real-time audio playback on V2s, select the "V2" speed.
- Seek Forward/Backward: This is a convenience feature. Seeking allows you to move through the audio while playing it back. It plays a preview of the sound as it seeks, so you can get a sense of when you want to stop and listen.
- Volume: Adjust the volume of the sound reproduction.
- Play/Pause: As explained prior, this button will play a reproduction of the sound collected from your machine.
- Fix FFT: This feature allows you to plot two or more FFTs simultaneously. Clicking 'Fix FFT' will keep the current FFT you are viewing on the FFT visualisation element, even as you continue to move through the time-series data. You can then select another time period in the data and click 'Fix FFT' again to plot the two FFTs on the same axis. You can fix multiple FFTs to compare multiple periods of operation and identity changes in the entire spectrum and individual frequencies.
- Clear Fixed FFTs: This removes any FFTs you have fixed from your FFT visualisation.
5. FFT Visualisation
This displays a Fast Fourier Transform visualisation of the data at any point/s in time which have been selected on the time waveform. Here you can zoom, pan around and download the plot as a PNG by clicking the camera icon.
You can create a waterfall plot by fixing multiple FFTs. To view the plot, you must select the 'Waterfall' tab. For those unfamiliar with waterfalls, our articles Understanding the Interactive Waterfall Plot and How to use the Interactive Waterfall Plot outline this visualisation in more detail.
A higher resolution FFT is accessible by selecting the grey/purple regions with diagonal stripes along the time waveform. This indicates 'on-demand' data; longer time series data captures of higher quality - a clearer, higher frequency resolution.
6. Options Panel
This panel provides different visualisation options for the FFT and Waterfall features. Here you can:
- Change the Graphy Mode: Switch between an Acceleration FFT or a Velocity FFT. Our article Introduction to Vibration explains what an Acceleration FFT displays in great depth. A Velocity FFT is unique in that it can make it easier to see changes in the lower frequencies and thus help VAs with domain knowledge in Velocity FFts better understand changes in vibration over time and pre-diagnose a broader range of issues with your equipment.
- Notably, the maximum frequency of the Acceleration FFT differs depending on what version of FitMachine you have installed. This is because V3 FitMachines sample at 25.6 kilohertz, whilst V2 FitMachines samples at 4Hz.
- Control the X-axis Units: Switch the horizontal axis from Hz to RPM, or 1x multiples of your fundamental harmonic marker as set in the Harmonic Markers options panel.
- Y-axis Mode: Switch between RMS and Peak-to-Peak.
- Switch between the time zone used (local time of your computer) and UTC.
- In future, you'll be able to set the time locally to wherever the FitMachine is in the world (applicable if the FitMachine is in a timezone different to your own)
- Show Point Annotations.
- Show Harmonic Markers and specify the multiple of the frequency or align from the peak pair.
- Include a High-Pass Velocity Filter.
- Autoscale within the Vertical Range: This will change the vertical axis such that you're able to see the whole range.
- Force Minimum Y = O: This sets the minimum value on the Y axis to always be 0, even when zooming.
- Switch to a logarithmic scale.
7. Data
The table below the FFT indicates the time and date that each time series data segment was collected, along with whether, at that point, the equipment was running, the condition score and the temperature and vibration readings. For clarity:
- Overall Condition: Condition score for that particular sample on a scale from 0-1, coloured corresponding to the region of the AI Output Chart.
- MMS: Overall vibration reading (in mm/s) in VELOCITY for the sample.
- GRMS: Overall vibration reading (in G's RMS) in ACCELERATION for this sample.
Clicking on a sample in this table allows you to jump to that point in the data and listen to the time series section collected at that time.
8. Activity Table
The activity table in the bottom right shows all alarms (including user-set thresholds) for that asset and acknowledgments, comments, and alarm validity classifications.
By clicking on an alarm, you can see the vibration at that point in time. As mentioned in our article Understanding the Time Waveform Plot, alarms are also indicated via icons along the Time Waveform.
Alarms that are greyed out indicate older alarms that are no longer within the timeframe of your current Waveform Diagnostic.
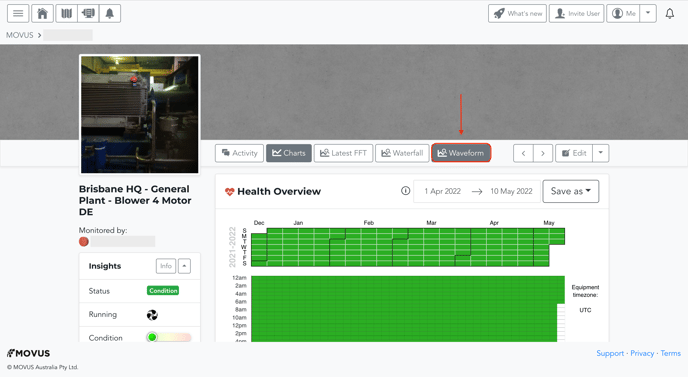
How can I access it?
You can find the Waveform Diagnostic button on the equipment detail page for any asset. Clicking the 'Waveform' button will bring up the page. Please ensure that pop-ups are enabled on your web browser. Otherwise, this will stop it from being able to load.
What else should I look at?
---
Thanks for reading. If you have any questions or concerns, please get in touch with MOVUS Support here.