
A waterfall plot is an important tool for remote monitoring vibrating assets. This article outline what it is, how to interpret it, and how it helps you.
How can it help you?
The waterfall plot is designed to help you identify trends and changes in an FFT over time by comparing the collected frequency and amplitude data.
This plot provides the context you need to understand what is a normal FFT for your asset and what is not - and thus identify possible failures that need investigating.
It can also be used post-maintenance to determine maintenance success by monitoring if there has been a decrease in the changes back towards the "normal" levels.
How does it work?
What are Waterfall Plots?
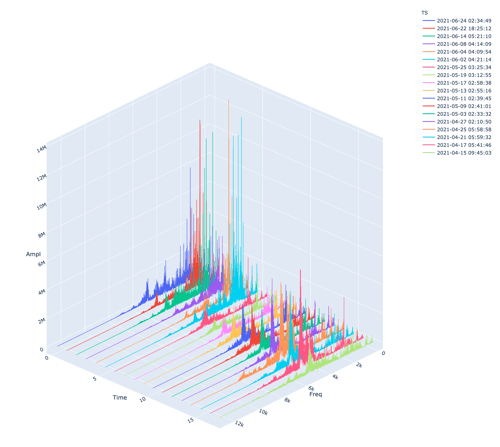
In vibration analysis, a waterfall plot is a three-dimensional graph that displays the frequencies of an asset over time. It consists of many two-dimensional FFT graphs stacked up against each other taken at different time stamps. They are used to visualise the change in vibration frequencies of a machine over time.
Our waterfall plot displays the collected FFT data for your asset over the past few days, weeks and months. The plot will be updated with the latest FFT every 2 days.
If you are unfamiliar with FFTs and would like to know more, please see our article Introduction to Vibration Analysis. An example of a waterfall plot can be seen below:
.png?width=688&name=_Users_David_Downloads_plotlyWaterfall.html(Old%20School).png)
How do I interpret it?
The main source of evidence for later-stage machine deterioration can be found in the low-frequency range (0-1000Hz) and typical VA collections recommend to review this region, or up to 2000Hz for most assets. In these regions, patterns can be seen between machine run speed, bearings, shafts, gear ratios and more and are typically characterised with an increase in the overall vibration of the machine. If a frequency observed in the past begins to increase slowly over time, this could indicate wear, and the machine should be scheduled for maintenance.
Earlier stage faults can be detected at frequencies as high as 23 000 Hz with high-frequency techniques however there is valuable information to be gathered between these frequency ranges.
Below is an example of machine health deterioration:
Looking at the lower frequencies, it is clear that over time, there has been a steady amplitude build at a specific frequency peak. Given the correct information and specifications about the machine, such as bearing geometry, gear ratios, and mains power input, it is possible to observe deterioration of these components.
Why should I use it?
Waterfall plots are very powerful tools that help us determine changes in machine health and performance. The ability to look back into the past and create a comparison to the current data is a necessity in determining what is happening to your machine.
By having past data in the form of an FFT we can compare this to current data and observe the steady or sudden increase in specific vibrations. If you have no comparison point, it can often be unclear if your machine is operating in its optimal state or if recent maintenance efforts have been successful. A waterfall plot can be a very powerful tool to identify and manage the faults with your assets, to prevent unplanned maintenance and production downtime.
What else should I be looking at?
- For information on how to access your waterfall data and how to use the tool, please read How to use the Interactive Waterfall Plot.
- Interactive FFT: this shows you a high-resolution FFT. With some vibration analysis knowledge, you can use information about the bearings/equipment to determine a potential cause of changes in the health of your equipment.
- Time Waveform: this allows you to listen to the accelerometer output of your machine. This gives you more information about what is going on with your equipment before maintaining it.
---
Thanks for reading. If you have any questions or concerns, please reach out to MOVUS Support here.