
This article outlines how the measured vibration levels and frequencies of equipment can be analysed to understand the health of your equipment and its components.
This article assumes you have read our Introduction to Vibration article, which provides a foundational introduction to vibration levels and frequencies, and how this is represented in an FFT. This article goes beyond that level, discussing further forms of visualisation, such as Waterfall Plots and Spectrograms, and how to interpret them.
What is Vibration Analysis?
Vibration analysis is the process of analysing measured vibration data to understand if the equipment is experiencing a deviation in condition. This information can be used to determine the health of your equipment and if there are any present or impending fault conditions such as misalignment, looseness or lubrication issues.
Many different visualisations of vibration data can be utilised. We provide three: the Time Waveform Diagnostic, the Interactive Waterfall Plot, and Interactive FFT. Notably, the Time Waveform Diagnostic includes both waveform and spectrogram visualisations.
Which Visualisation Should I Use?
Interactive FFT
On its own, an FFT breaks down a vibration signal into all its frequencies. Therefore, it is most helpful in analysing the vibration at a point in great detail.
Understanding the equipment's running speed (commonly shown in RPM) can be extremely useful for analysing an FFT, as it allows you to differentiate between frequencies that are multiples of the run speed and those that aren't. This is an important first step in identifying potential faults.
For example, consider a three-blade fan being driven by the 50Hz (3000RPM) electric motor of a car. The shaft will complete one full revolution 50 times every second. If we pick a point on the fan housing, three fan blades will pass this point with each rotation of the shaft. This causes a force each time a blade passes which we detect as vibration. As three blades are attached to the shaft, there will be one of these forces detected three times per shaft rotation, meaning this force is occurring 150 times per second or at 150Hz (9 000 RPM).
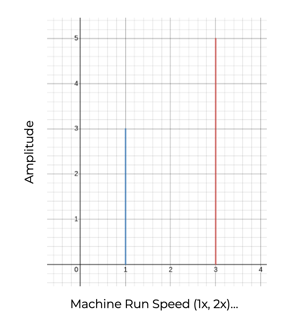
There are other types of fault that present themselves in multiples of the equipment run speed, such as times of looseness, misalignment, and pump vane issues. To easily identify these, you can order-normalise an FFT, which converts frequencies in Hz or RPM into orders of the shaft speed. This way, the peaks in the spectrum occur at 1X, 2X, and 7X, which are 1 time, 2 times and 7 times the shaft speed, respectively. The example below shows our 3-bladed fan with the vibration spectrum order-normalised to show the vibration at 50 Hz (1X) and 150Hz (3X).
If, however, over time the FFT changed into the following FFT, certain conclusions can be made.
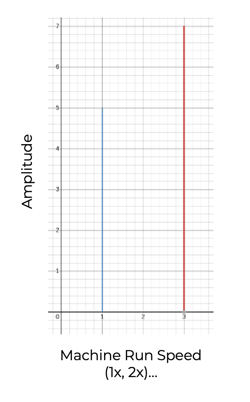
As you can see, the amplitude of the recorded vibration increased at one and three times the machine's run speed. Since we know that these frequencies relate to our shaft speed and the number of blades on our fan, if there are no other changes in the spectrum, we could conclude this increase is due to a dust build-up on one of the fan blades. This increased weight will increase the magnitude of the vibration recorded every time the fan rotates being 1x the run speed. This is a simplified example and FFT; however, you can apply the same processes to more complex vibration data.
Identifying the running speed of equipment is, therefore, highly significant. Usually, you'll be able to get the run speed of the equipment from your control system or the equipment's nameplate. If you don't have access to this information, you can usually infer the running speed from the mains power supply frequency. In Australia, we use 50Hz, so most of our assets run at around 50Hz, or half that depending on the motor. Hence, the asset is likely operating with 50Hz as its base (1x) run speed. In America, mains electricity is supplied at 60Hz, so equipment generally operates around 30 or 60Hz. If you look at your FFT, the first major peak you see should appear around one of these frequencies. Certain components such as VSDs, belt drives, and gearboxes change the speed of the shaft, so be aware of these when looking for your shaft speed.
Once identified, you can use our Harmonic Marker feature, discussed in more detail here, to highlight which parts of the spectrum are multiples of the shaft speed. Alternatively, you can calculate the multiples of the shaft speed by dividing the frequency by the machine run speed.
Time Waveform Diagnostic
Alternatively, the time waveform diagnostic is very useful for identifying transient issues with operation that may not be present during regular vibration sample collections.
This is because it allows you to visualise the equipment's vibration over the past three days, and hence understand daily changes in the vibration, such as changes in the intensity of the peaks. You can also listen to the sound of your machine, which often makes issues like chipped gear teeth apparent.
Following the earlier example, using the FFT, we could identify the engine's idle rotational speed of 150Hz at one point in time. However, we could not identify how the vibration frequency of the engine may change throughout a period of operation. For example, how does the vibration change if the car were turned on, idled, revved, idled again, and then turned off?
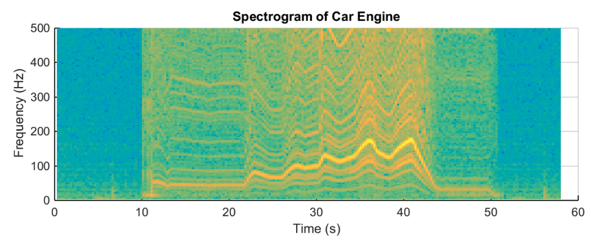
This is where a spectrogram is particularly useful. A spectrogram is a two-dimensional view of all the FFTs we've collected, stacked beside each other, where the amplitude of each frequency is differentiated using a colour scale. Below is a spectrogram of the same vehicle as above.
 Source: https://blog.endaq.com/vibration-analysis-fft-psd-and-spectrogram
From this spectrogram, it can be determined that the engine is off from 0-10 seconds before sitting idle (30Hz) from 10-20 seconds before revving at differing frequencies from 20-40 seconds and then finally idling from 40-50 seconds before being turned off.
Spectrograms are a seldom-used tool in vibration analysis as the frequency of data collection is generally too low to make them useful. However, as the FitMachine is collecting vibration data every 15 minutes, this is an excellent tool for understanding how your equipment operation changes throughout the day/week.
Waterfall Plot
Lastly, to understand long-term trends and changes in an equipment's vibration and how it has strayed away from its 'normal' running state, you can use the Waterfall plot. Waterfall plots display multiple FFTs over time and thus allow you to compare the collected frequency and amplitude data to understand what is normal and what is an abnormal deviation. This can then be utilised to determine what part of the machine is not working as intended. Waterfall plots have been used as valuable tools in vibration analysis for decades and show the change in the presence and amplitude of the peaks.
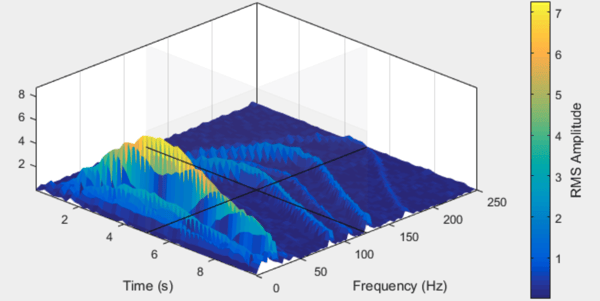
For instance, continuing with the example, a Waterfall plot can visualise how the state of the same car engine varies with time. The Waterfall plot is similar to the spectrogram, except it displays the FFTs in three dimensions, while the spectrogram is a top-down view of a waterfall plot. If you were to collect multiple FFTs over the duration of the car starting and then plot your results, you would generate the waterfall below.
 Source: https://lost-contact.mit.edu/afs/inf.ed.ac.uk/group/teaching/matlab-help/R2016b/signal/examples/order-analysis-of-a-vibration-signal.html
From this waterfall plot, examining the 30Hz frequency, it can be determined that the car takes approximately 3 seconds to reach an idle state (RMS Amplitude of 3) after being turned on. The car sits idle from the 3 to 5-second mark, where the 30 Hz frequency stays constant, whilst some higher frequencies (e.g. 50Hz, which reaches the RMS Amplitude of 7) are increased due to noise/chatter in the engine increasing. The car is then turned off at approximately 5 seconds when all the frequencies trend to zero.
Hence, by using these three visualisations, you can determine whether a machine requires maintenance to either increase efficiency or prevent a fault from becoming a failure.
---
Thanks for reading. If you have any questions or concerns, please reach out to MOVUS Support here.