
This article outlines what Interactive FFT is, how it helps you, how you can use it, and how you can access it.
How can it help you?
This feature requires some prior knowledge in the Vibration Analysis field to understand.
To those who understand it, this chart can assist with preliminary fault identification, and help to determine which maintenance activities are likely to resolve the issue.
How does it work?
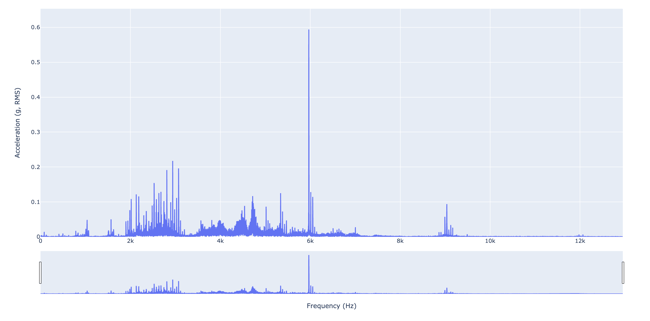
Interactive FFT is a feature that displays the Fourier transform of the vibration signal collected by FitMachine sensors, which can be used for traditional fault diagnostics. 'FFT' is an acronym for the Fast Fourier Transform algorithm.
This is different from the data displayed on the AI Output chart, as the AI Output displays a compressed summary of the vibration data, for the purpose of detecting unusual behaviour.
This feature provides you with an Interactive FFT every 2 days.
How do I use it?
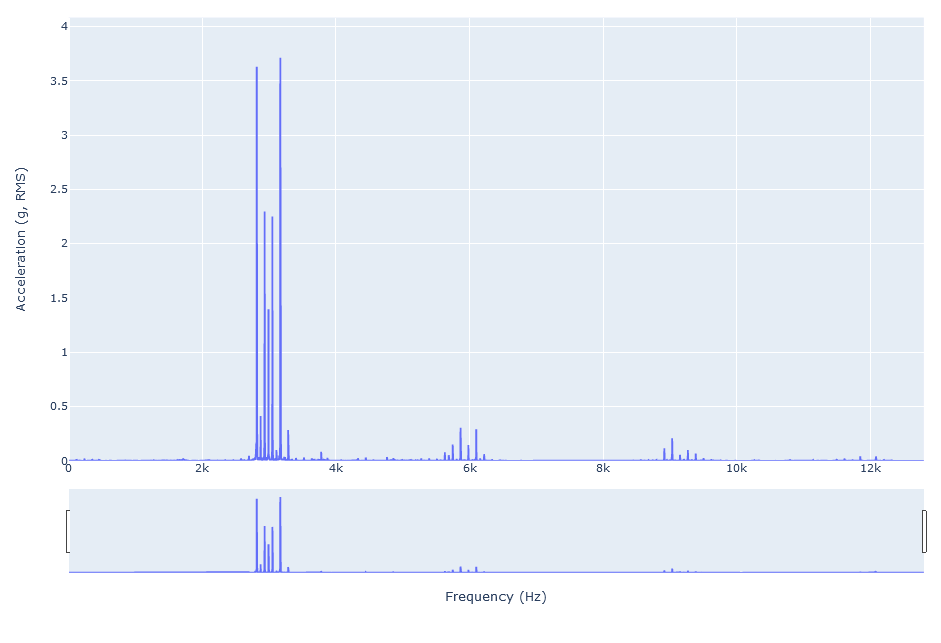
As the name gives away, the FFT chart is interactive. That means you can:
- Zoom in and out to analyse a portion of a spectrum
- Show or delete annotations
- Show harmonic markers
- Transform the Acceleration FFT into a Velocity FFT
Zooming In
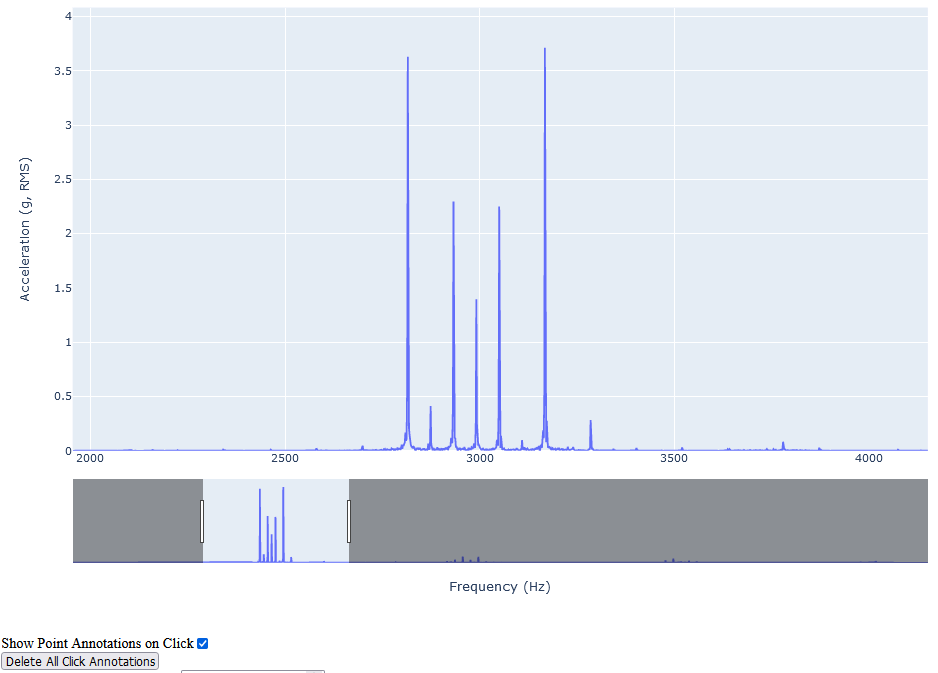
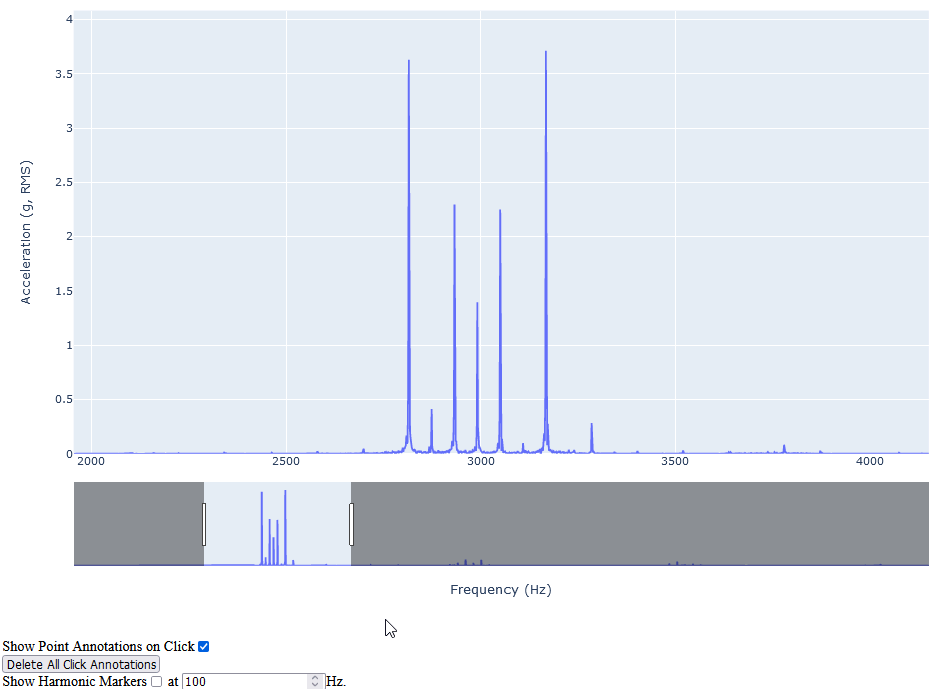
To analyse a portion of a spectrum you can zoom in using the slider at the bottom of the chart, or use a bounding box.
Zooming In Using the Slider:
To adjust the frequency you are viewing, simply click and drag the highlighted section of the slider. To zoom in and see a smaller range, adjust by dragging the edges.
To autoscale the vertical axis within the horizontal range, and ensure the range you are viewing is scaled to fit the chart, check the 'Autoscale within Horizontal Range' box at the bottom of your screen (see example gif below).
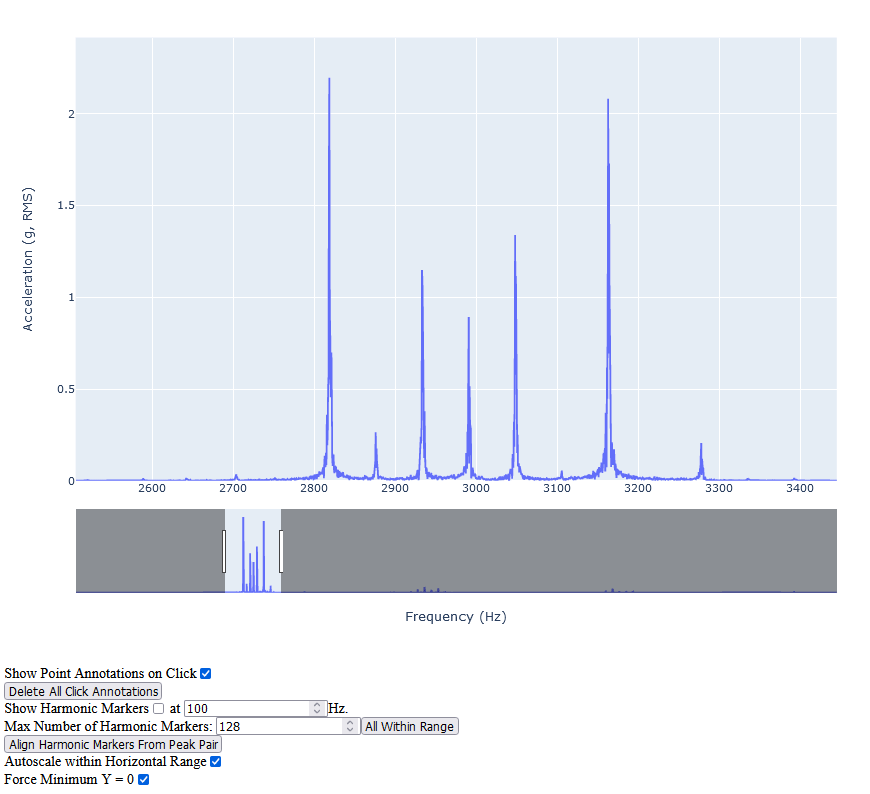
Zooming In Using a Bounding Box:
Alternatively, you can zoom in vertically using a bounding box. To do this, draw a rectangle over the desired range of the chart. This will automatically zoom you in and autoscale the range to fit the chart (see example gif below).
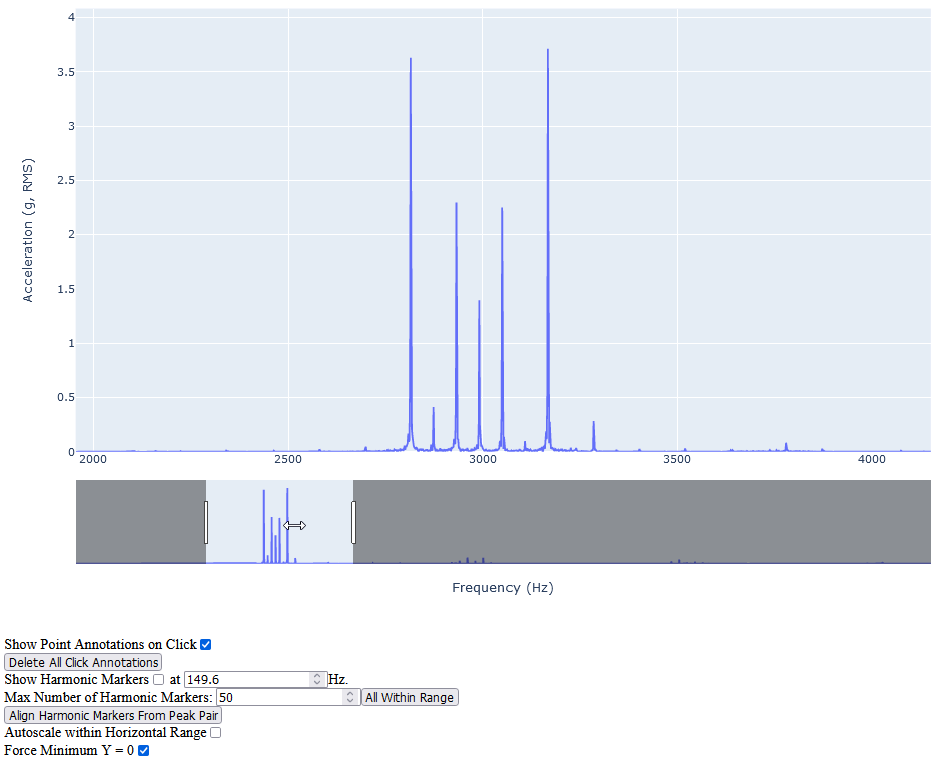
Show or Delete Annotations
You can annotate the chart by clicking the peaks. This will add the exact details of the peak to the chart (in the format Frequency, Acceleration) so you can easily compare them side-by-side.
The feature will not work unless the 'Show Point Annotations on Click' checkbox is selected at the bottom of your screen. However, this should be selected automatically.
To clear the chart of any annotations, click the 'Delete all Click Annotations' button (see example gif below).
Show Harmonic Markers
You can choose to show harmonic markers at either a specified frequency or aligned with the peaks.
Harmonic markers highlight which parts of the spectrum are caused by vibration with a particular fundamental frequency. For example, if you have a vibration that repeats at 50Hz, if it isn't a sinusoid, then an FFT of it will have peaks at 50, 100, 150, 200, and so forth.
On the chart, these repetitions are shown as 1x, 2x, 3x, 4x, and so forth, where 1x represents the fundamental frequency.
Showing Harmonic Markers at a Specified Frequency:
To manually place markers at a specified frequency, check the 'Show Harmonic Markers' box, and type or use the arrows to change the frequency (see example gif below).
Automatic Harmonic Marker Placement
Alternatively, you can automatically place the markers aligned with the peaks through peak pair selection. This is done by clicking the 'Align Harmonic Markers From Peak Pair' button, and selecting two peaks (see example gif below).
Transform the Acceleration FFT into a Velocity FFT
By clicking 'Velocity FFT', you can also transform it so you are viewing a Velocity FFT instead.
A Velocity FFT can make it easier to see changes in the lower frequencies, and thus help VAs with domain knowledge in Velocity FFts better understand changes in vibration over time and prediagnose a broader range of issues with your equipment.

How can I access it?
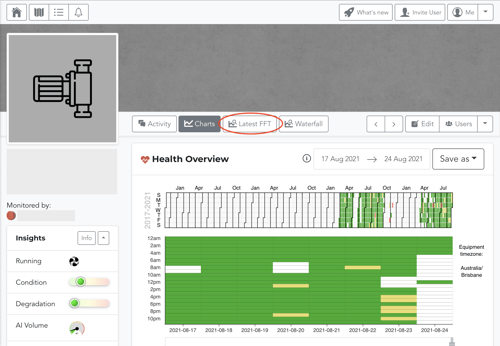
The most recent interactive FFT can be viewed by visiting a specific Equipment Detail View and clicking the "Latest FFT" button.
What else should I be looking at?
Other diagnostic features that we have include:
- Interactive Waterfall Plot
- Time Waveform Diagnostic
- Introduction to Vibration
- Introduction to Vibration Analysis
---
Thanks for reading. As always, if you have any questions or concerns please reach out to MOVUS Support here.