
This article outlines how you can access and use the Interactive Waterfall Plot tool.
A waterfall plot is an important tool for remote monitoring vibrating assets. The article Understanding the Interactive Waterfall Plot outlines what it is, how to interpret it, and how it helps you.
This article discusses how to access your waterfall data and how to use the tool.
How can I access it?
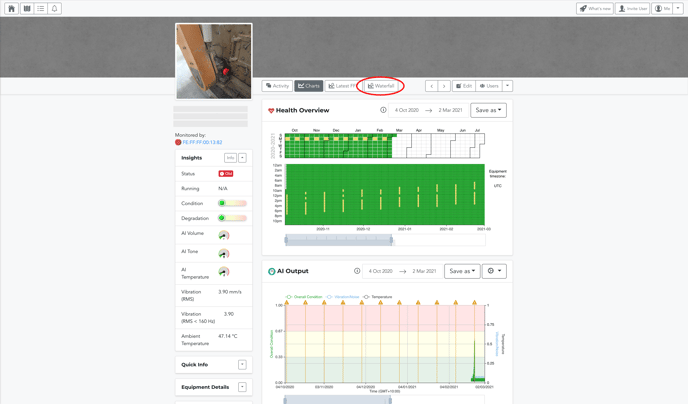
The chart will be located on the device page for any asset. Clicking the 'Waterfall' button will bring up the interactive plot. Please ensure that pop-ups are enabled on your web browser. Otherwise, this will stop the plot from being able to load.
How do I use it?
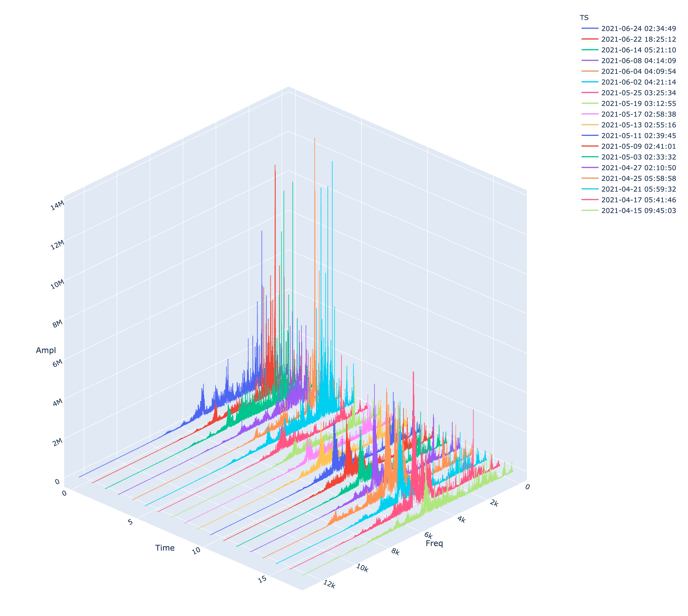
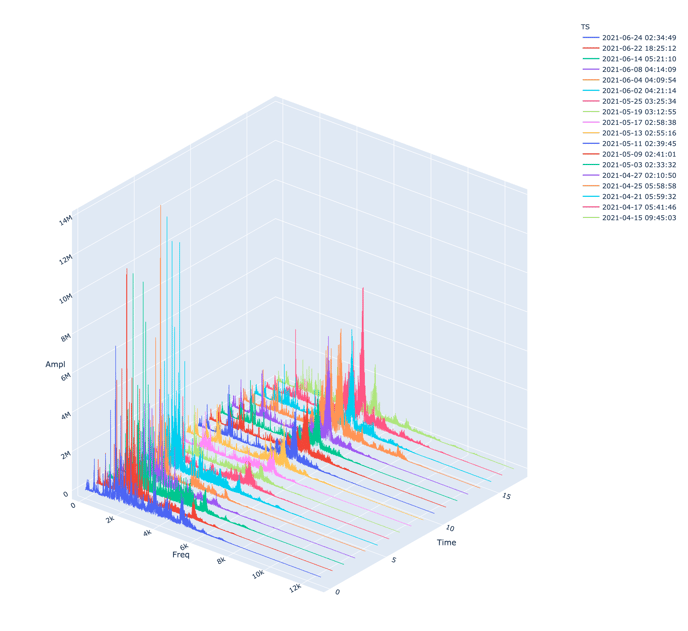
The waterfall plot is interactive, meaning you can adjust the frequency window, zoom, rotate, pan, and change the dates you are viewing. It's recommended you use a mouse for this feature as a laptop trackpad can be quite fiddly.
Adjusting the Frequency Window
In the top left-hand corner, you can adjust the frequency range you are viewing by altering the maximum frequency. The four options you can select include 250Hz, 500Hz, 1kHz, and 2kHz.
Zooming In
You can zoom in to certain parts of the graph using the scroll wheel on your mouse (two fingers on a trackpad).
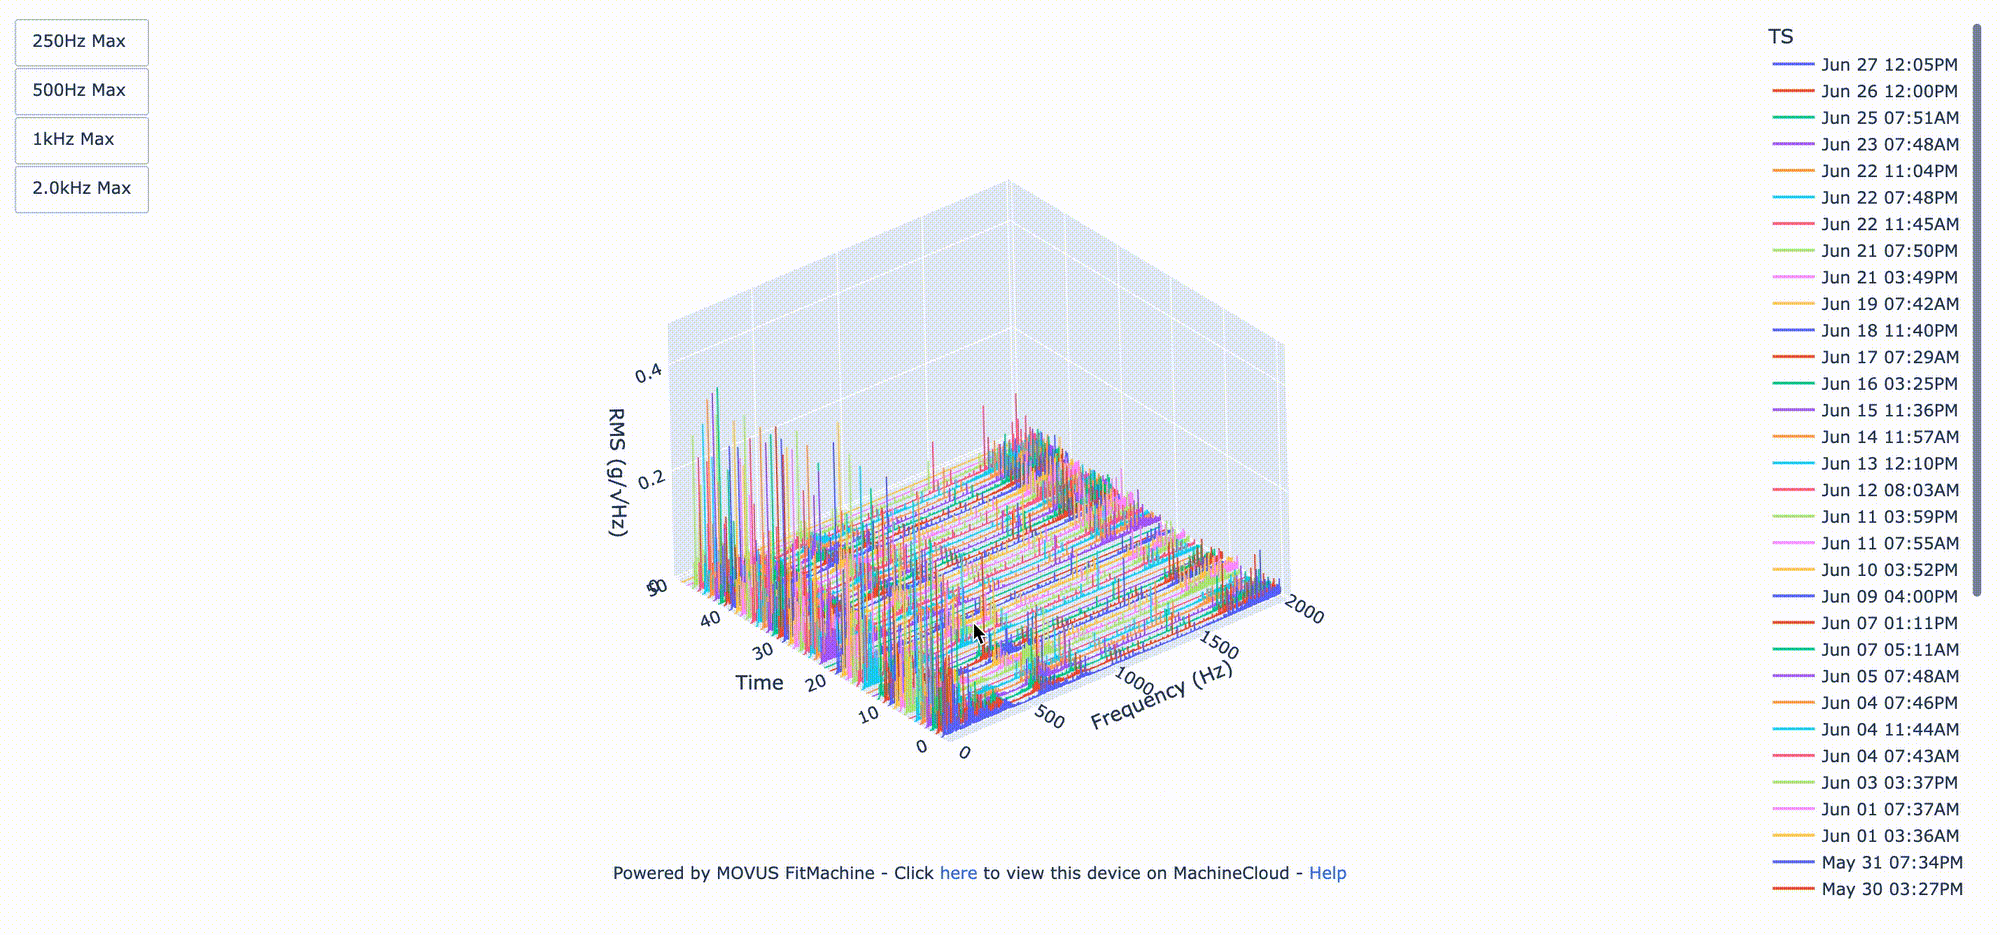
Panning
To pan, right-click and drag (on a trackpad you need to click and drag with two fingers). This will adjust where the plot sits on your screen.
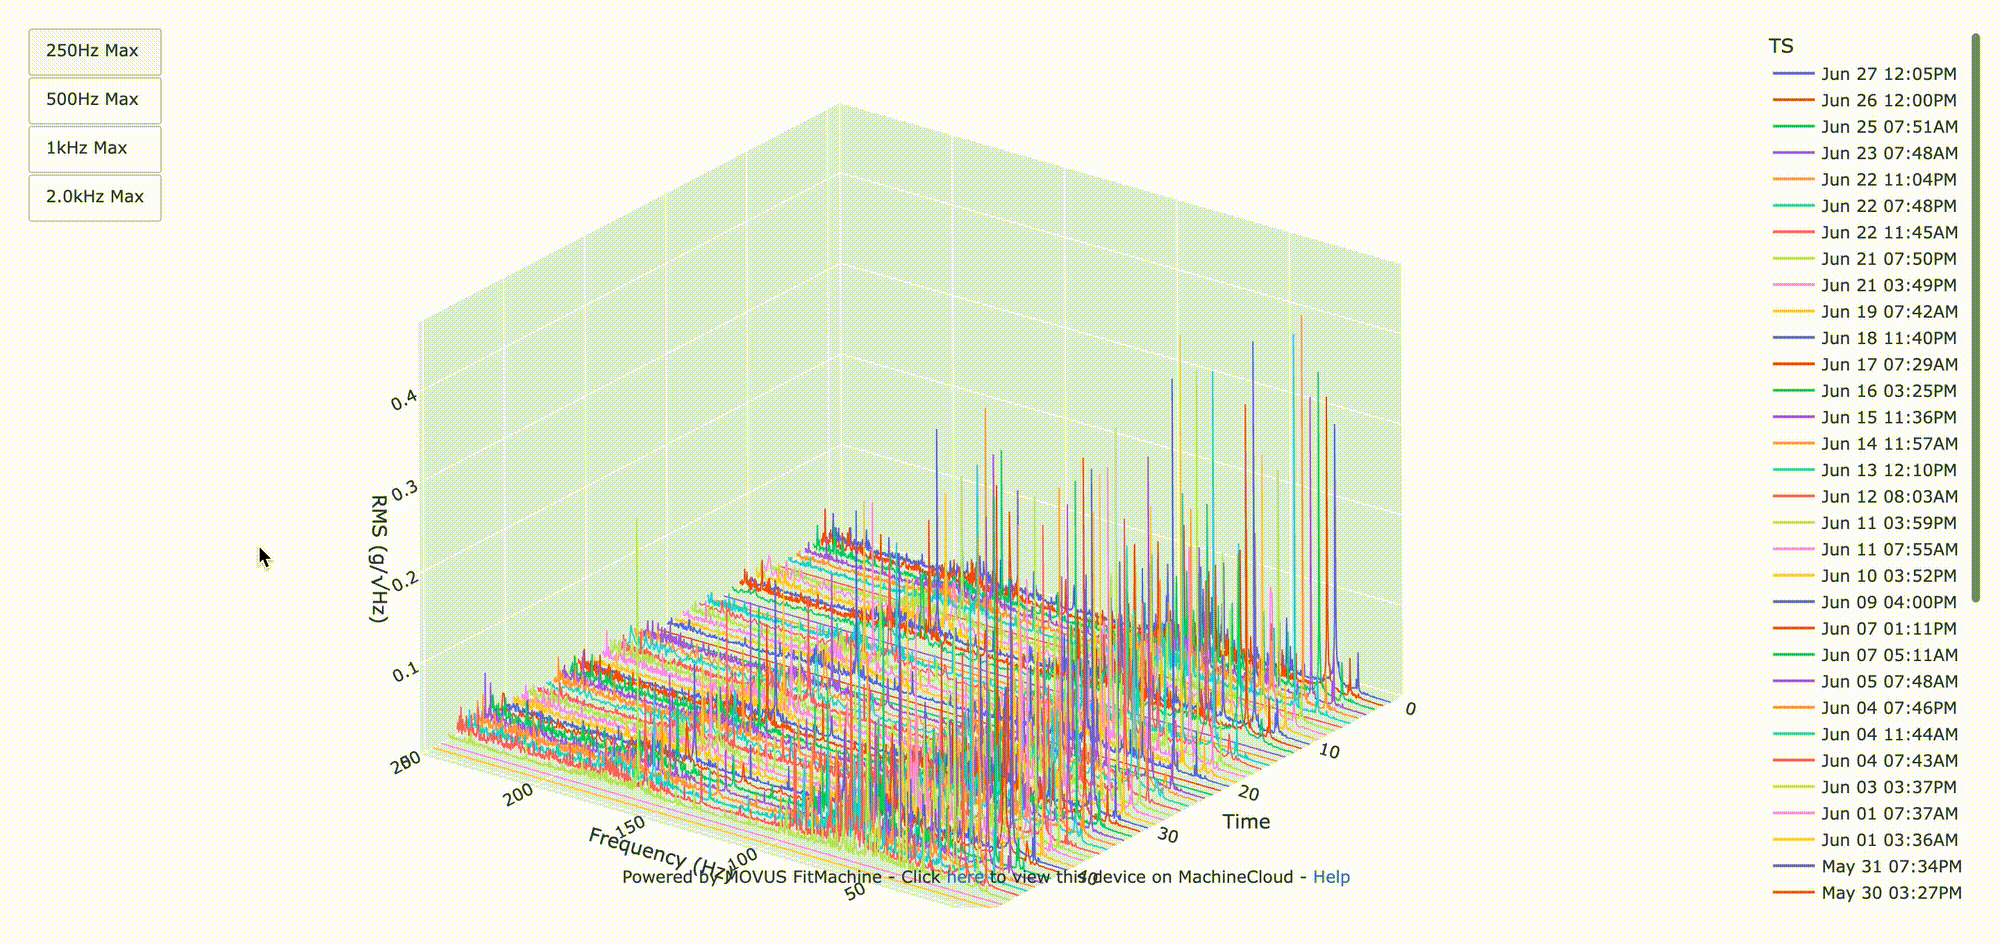
Rotating
To rotate, left click and drag (one finger on a trackpad). Doing so will allow you to rotate your view, so you can compare the data from different angles or change which axes time and frequency sit on (see below).
 |
 |
Extra Tips
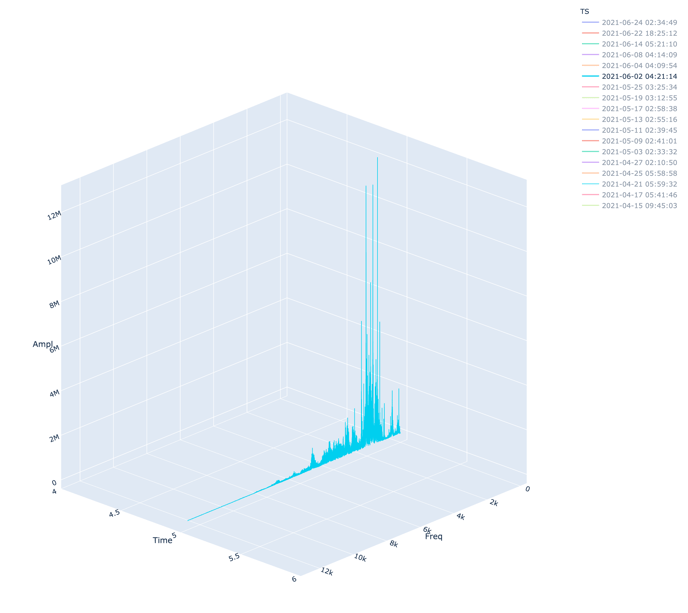
Mouseover (hovering over) the FFTs shows the frequency/magnitude.
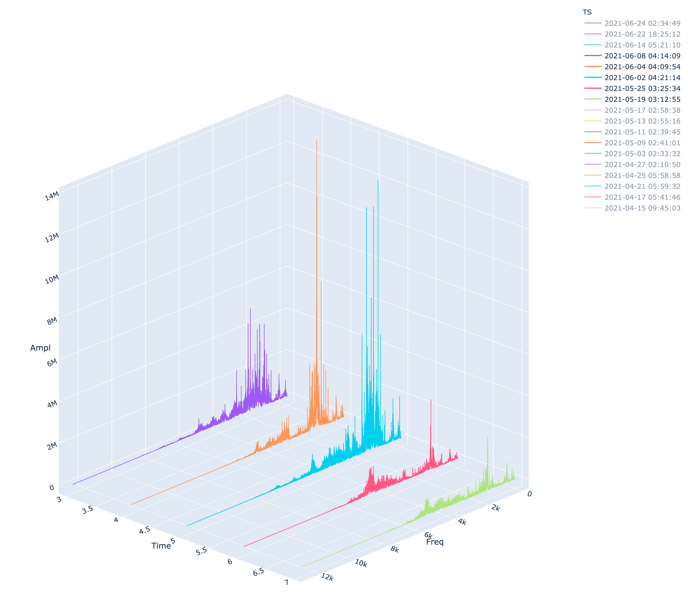
By double-clicking on a date in the top right-hand corner you can isolate an FFT. To compare several frequencies over time, you can then (with a single click) select other dates (see below).
 |
 |
Please note the colours do not have any significance. The plot simply rotates through ten different colours to help you distinguish between each FFT, and act as an indicator of time.
What else should I be looking at?
- Understanding the Interactive Waterfall Plot
- What is a Spectrogram?
- Understanding Interactive FFT
- Understanding the Time Waveform Diagnostic
---
Thanks for reading. If you have any questions or concerns, please reach out to MOVUS Support here.