
This page of the dashboard shows all of the equipment being monitored by your sensors.
How can it help you?
This is our most commonly used page on the dashboard. This page is used to look at your entire deployment to understand what is happening with your monitored equipment.
This page can help you to prioritise which equipment needs your maintenance attention and can help to reduce breakdowns, downtime and costs.
How does it work?
After selecting the equipment list button, users will be able to view the equipment monitored by each sensor type available. This can be done selecting the buttons beside the "Monitored by " text above the equipment list.
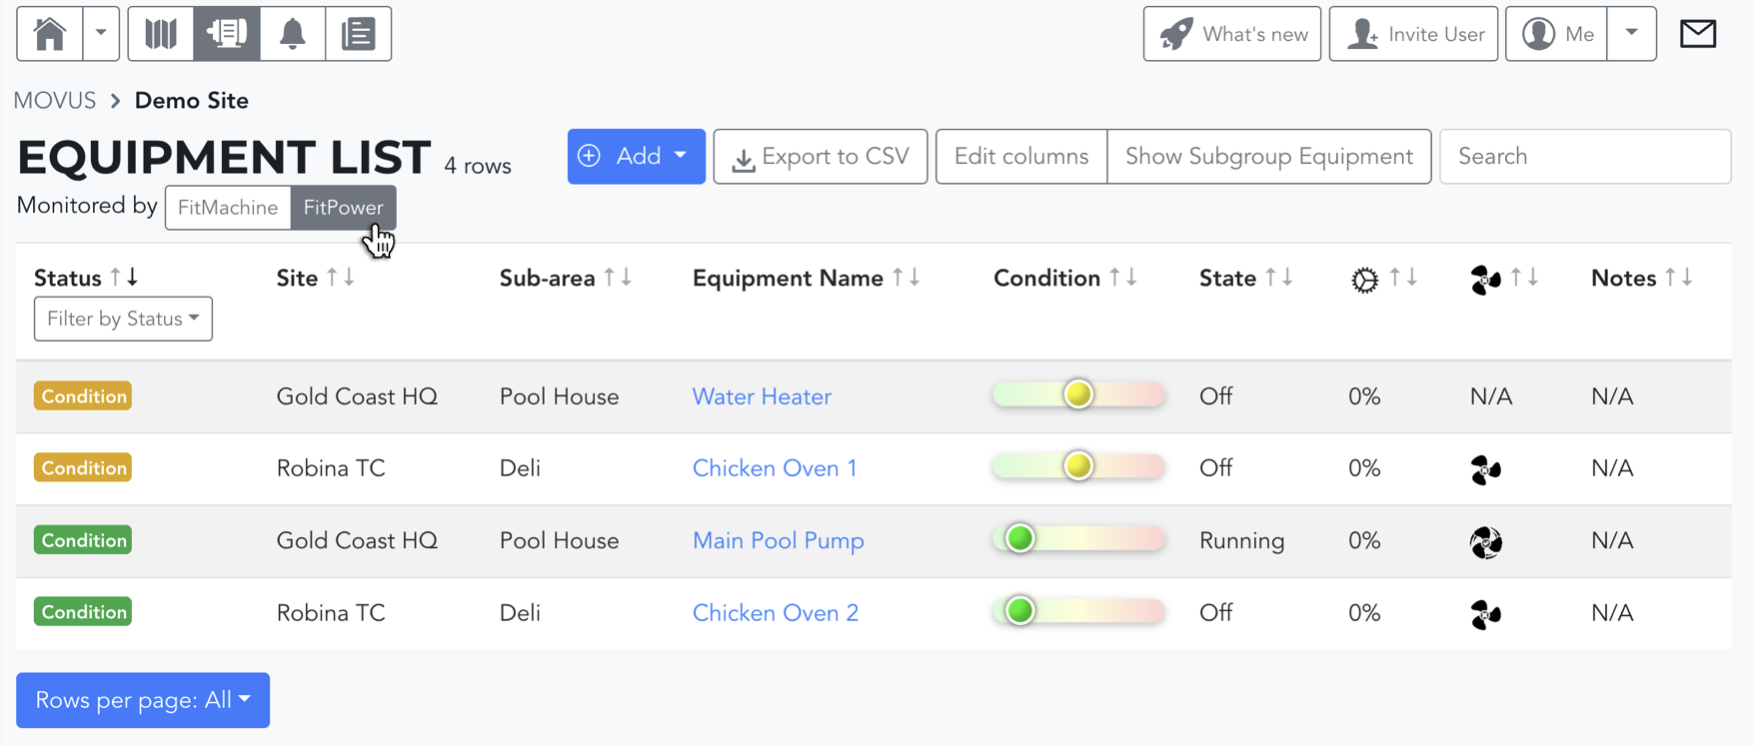
On this page, the default ordering of the page is to have the equipment with the worst condition at the top, however, you can click the arrows next to each heading to reorder the equipment. For example, re-sorting into alphabetical order via Equipment Name. You can also use the search bar to find a specific piece of equipment by typing either its name or MAC address.
The information that you can find on this page includes the following where unless mentioned, the information is relevant for all sensor types:
- Condition Status: Indicates whether the equipment requires your attention. The status will reflect if:
-
- The equipment is in a healthy condition
- The equipment has recently experienced an alarm, and what type
- The equipment is off/on standby (set through the equipment's role)
- The sensor is experiencing network (communication) issues
- The sensor has a low battery, or
- The sensor is not-reporting.
- The urgency of the matter is expressed through the colour of the status. Green indicates normal, yellow is a warning, and red indicates critical. If the asset is experiencing more than one issue, for example, it has recently experienced a significant condition change (red alert) and has a low battery, only one will be shown at a time. The most urgent matter will be shown.
- You can filter the status column to show the matters most relevant to you. However, please keep in mind that the filters you choose will be saved in future sessions (ie. even if you close your browser, or log out).
-
- Learning progress: How far through the learning period the FitMachine is.
- Site: The location of the plant
- Sub-Area: The location within the plant where the equipment is
- Equipment Name: What you call the piece of equipment. This links to the equipment's Detail Page.
- Condition: This slider indicates the current health of your asset. The further away from the green the slider is, the further the asset's condition has deviated from its learned baseline. It’s useful for gathering real-time insights into the health of your fleet whenever you need it and alerting you and your team when an issue arises.
- Degradation: The rate of change calculated by the FitMachine AI. Degradation is useful when deciding which out of a series of unhealthy assets should be inspected or maintained first.
- Vibration: shows you the most recent RMS measurement collected by the FitMachine
- Temperature: shows you the most recent temperature measurement collected by the FitMachine
- Utilisation: For equipment monitored by a FitMachine, this is calculated based on how often the equipment has been above the running cut-off in the last 4 weeks (and thus considered to be running). For equipment monitored by a FitPower, it is calculated based on how often the equipment has been running at a current of 0 (off) in the last 4 weeks.
- Inferred Power: The utilisation calculated from the FitMachine is multiplied by the power rating of the equipment to approximate how much power is being used. If you do not enter a value for the Power Rating of the equipment you’re monitoring the MOVUS AI cannot calculate the Inferred power usage and will display a padlock.
- Running Status: Whether or not that equipment is running based on the most recent sample. The fan icon spins to indicate running and is stationary to indicate not-running. For the FitMachine, the status is dependent on the Running Cut-off being set properly, to do so, see our article here. For FitPower, the equipment is considered running if the current is greater than 0, or the most recent sample is categorised as an operating mode that has been identified as an equipment running state.
- Notifications status: Shows you if someone has muted yellow advisory alarms from the FitMachine.
You can also:
- Select the "Show Subgroup Equipment" button next to the search bar to include the equipment in the subgroups of your selected Device Group in your view. This is explained in our article Understanding Device Groups.
- Select the "Edit Columns" button to choose what columns you wish to view in the equipment list and also change the order in which they are displayed.
- Select the "Export to CSV" button to download a CSV file of the data displayed on this page.
What else should I look at?
These are some of our related articles:
- About the Equipment Detail Page
- About the Standard Home Page
- About the Alarms Page
- About the What's New Page
---
Thanks for reading. As always, if you have any questions or concerns please reach out to MOVUS Support here.