
This chart provides an easy way to compare your equipment's energy usage across different time periods.
How can it help you?
This chart provides an easier way to compare your equipment's energy usage across different days, weeks and/or months. This can be highly beneficial for several reasons, such as you can:
- Analyse energy consumption patterns and understand the associated costs.
- Detect anomalies or deviations from expected energy consumption patterns that may indicate equipment malfunctions.
- Gain valuable insights into your industrial processes, such as identifying peak energy usage periods.
- Monitor and assess the energy efficiency of your industrial equipment over time, identifying potential areas of improvement and implementing energy-saving measures.
How does it work?
The Energy Use chart is a calendar chart on which the x-axis represents time, and the y-axis represents energy (kWh). On the chart, you can view and compare the data by day, week or month.
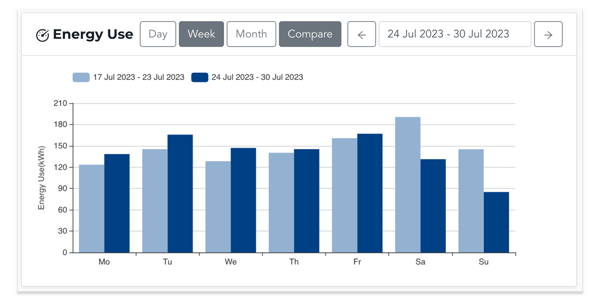
Day: Under the 'day' option, for each day, the data is shown hour by hour.
Week: When you select the 'week' option, the data is displayed for each day of the week, starting from Monday and ending on Sunday. For instance, if today is Tuesday the 23/5, the week option will show data from 22/5 to 28/5. Each day has a summary of the 24 hours.
Month: The 'month' option shows your energy data day by day, over the last 4 weeks.
Across each date option, the 'previous' data you are comparing with will be a slighter lighter blue. Where your equipment was not running the data will be displayed in white. Each item will display a time stamp, energy value and cost value upon hovering with your mouse. The cost value is shown in your local currency.
You also cannot select a date that is beyond the sample's earliest, or latest date.
How do I access it?
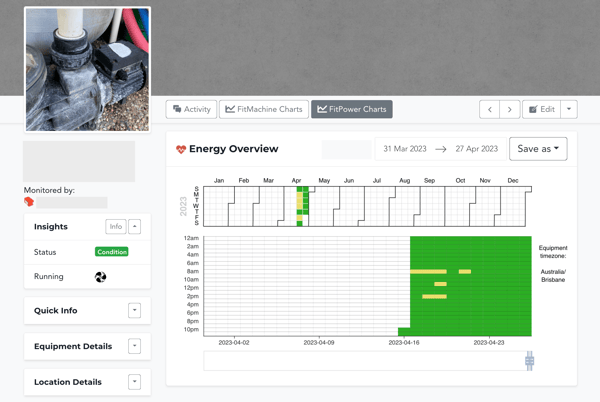
The Energy Use chart can be found on any asset's Equipment Detail Page, under the 'FitPower Charts' tab.
The FitPower Charts Button will not be visible if your organisation has no FitPower sensors installed. If your equipment has both a FitMachine and FitPower installed, you can link the sensors and view both charts on the Equipment Detail Page. To do this, simply click the down arrow next to "Edit" on the Equipment Detail Page.
Please see the image below for reference:
What else should I look at?
- About the FitPower Equipment List Page
- Understanding the FitPower Measured Data Chart
- What is the Equipment States Chart?
- Understanding the Energy Overview Chart
---
Thanks for reading. As always, if you have any questions or concerns please reach out to MOVUS Support here.