
This article explains what FitPower Based States are, and how to interpret the Equipment States Chart.
How does it help you?
The Equipment States chart displays the different operating states of an asset and the times in which the asset has operated within each. This chart can be used to identify trends and potential deviations in the equipment's state that could impact its condition. For example, when the asset is consistently running or not-running, and at what time during the day or week an asset is experiencing changes in energy usage.
How does it work?
What are FitPower Based States?
The Equipment States chart is based on FitPower Based States.
FitPower States are groups of datasets recognised by FitPower that have common characteristics. For now, your equipment will have two states, "running", and "not running". Equipment will be labelled as "running" when its current consumption is greater than zero, and labelled as "not-running" when it has a zero current.
This feature capacity is currently being developed to recognise alternate operating modes outside of "running" and "not running" which you can define. For example, it may detect "unknown" running states you can label as standby, preheat, cooking or cleaning modes for an oven. Keep an eye out!
How do I interpret the chart?
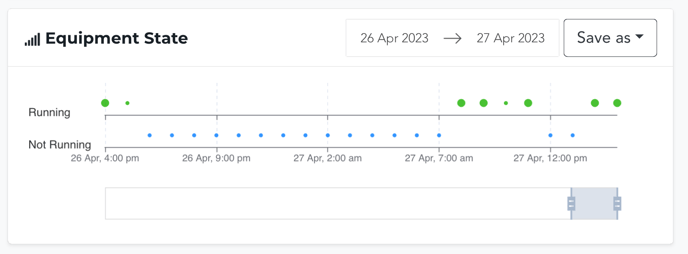
The vertical axis of the chart is separated into state values, and the horizontal axis of the chart measures the date and time. Across the chart, samples are represented in a scatter plot format. The colour of the samples correlates with the equipment's Condition Status, explained in our article Understanding the Energy Overview Chart. Hence, the colours include:
- Green Samples: The condition status was green.
- Yellow Samples: The condition status was yellow. The circle should increase in magnitude proportionally to the deviation size.
- Red Samples: The condition status was red. The circle should increase in magnitude proportionally to the deviation size.
- Blue Samples: The equipment was detected as not running.
You can use the calendar feature at the top of the chart or drag the slider below it to adjust the date you are viewing, and the "Saves As" button allows you to either save the data as a CSV file or save the image as a PNG if you desire.
How do I access it?
The Equipment States chart can be found on any asset's Equipment Detail Page, under the 'FitPower Charts' tab.
The FitPower Charts Button will not be visible if your organisation has no FitPower sensors installed. If your equipment has both a FitMachine and FitPower installed, you can link the sensors and view both charts on the Equipment Detail Page. To do this, simply click the down-arrow next to "Edit" on the Equipment Detail Page.
What else should I look at?
- Understanding the Energy Overview Chart
- Understanding the FitPower Measured Data Chart
- About the Equipment Detail Page
---
Thanks for reading! If you have any questions or concerns, please reach out to MOVUS Support here.