
This chart shows variances in the relative current your equipment consumes over time.
How it helps you
You can use FitPower's Measured Data Chart to look for trends in your equipment's relative current consumption and discover how your equipment is changing.
By understanding your equipment's relative current draw, you can identify opportunities for improving energy efficiency, identify areas where energy consumption can be reduced, and better understand potential equipment issues.
Update: Measured data alarms have now been added for the FitPower sensor.
How does it work?
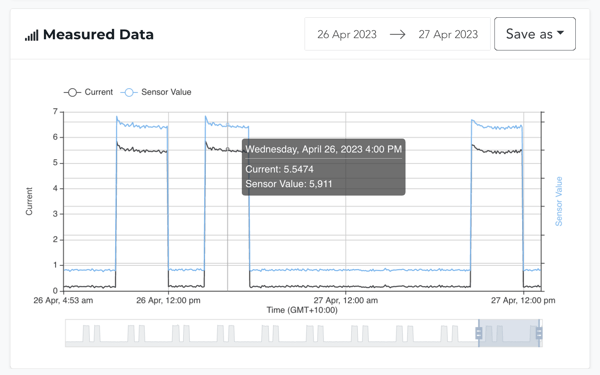
The Measured Data Chart displays your equipment's relative current consumption over time, as compared to the calibrated current (where setup).
A data point is plotted for each sample that the FitPower sensor sends.
The left-hand axis of the chart represents the equipment's current consumption, the right-hand axis measures the sensor value, and the horizontal axis is the date and time.
In this context, 'Current' indicates the calibrated current.
When onboarding, users will only see the sensor value which indicates the relative current of equipment. This will be useful to spot patterns and trends in the data.
Given motor information, Movus can calibrate this data to display a current in Amps.
A value of zero indicates that your equipment is not running. The other values along the y-axis are scaled and simply there to help illustrate the degree of changes in energy usage.
Some trends to look out for include:
- An upward trend is significant if it accelerates, signalling a deteriorating piece of equipment.
- Recurring changes. These could be specific parameters affecting how the equipment operates or related to process changes.
You can use the calendar feature at the top of the chart or drag the slider below it to adjust your viewing date. The "Saves As" button allows you to save the data as a CSV file or the image as a PNG.
How do I access it?
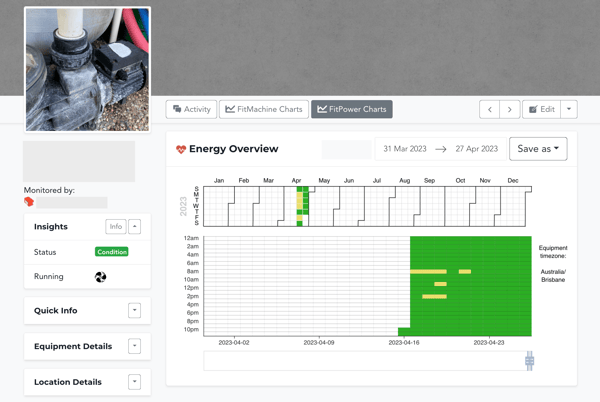
The FitPower Measured Data chart is on any asset's Equipment Detail Page under the 'FitPower Charts' tab.
The FitPower Charts Button will not be visible if your organisation does not install FitPower sensors. If your equipment has a FitMachine and FitPower installed, you can link the sensors and view both charts on the Equipment Detail Page. To do this, click the down arrow next to "Edit" on the Equipment Detail Page.
Please see the image below for reference:
What else should I look at?
---
Thanks for reading. As always, if you have any questions or concerns, please don't hesitate to contact MOVUS Support here.